Risk, opportunities,
AND CHALLENGESTo understand how flooding and other climate-related hazards could impact people and places in the region, Resilient Northeastern NJ conducted assessments that guided development of solutions. The Flood Impact Assessment focused on coastal storm surge, tidal, and rainfall flooding and quantified impacts using new flood models developed by NJDEP for the Resilient NJ program. This assessment incorporated information from the visioning process to understand flood-prone areas based on resident expertise and to understand what places or things, called assets, hold significant value to people. The Climate Hazards Assessment looked at a range of additional climate-related hazards, like heat, poor air quality, contamination, and groundwater rise, and considered current impacts to the region and expected future trends. Click the links below to explore these reports. Scroll down to see highlights from the reports.
Flood Impact Assessment
Appendices
- APPENDIX A: NJDEP Modeling Methodology
NJDEP Risk Assessment Methodology (pdf) | NJDEP Modeling Methodology (pdf) - APPENDIX B: Resilient NENJ Model Updates
NENJ Model Updates Methodology (pdf) - APPENDIX C: Methodology – Consequences & Asset Exposure
NENJ Flood Impact Assessment Methodology (pdf) | Attachment A: Data Sources (xlsx) - APPENDIX D: Critical Asset Inventory and Assessment
NJDEP Asset Assessment Table (xlsx) | Scoring of All Critical Assets (xlsx) | Critical Asset Inventory Database (zip) - APPENDIX E: Loss Summary Tables for Each Study Area & Event
Flood Impact Summary Tables (xlsx)
What is Risk?
Risk is the potential for a hazard to have negative impacts. In terms of flooding, risk means the potential for water to damage and / or disrupt our communities. Risk increases when the hazard increases, such as from the effects of climate change. Risk also increases when there is potential for more impact. For instance, risk increases when more people and their belongings are in harm’s way. The more people affected or the more critical a system is, the higher the risk.
What Types of Flood Hazards Should We Be Concerned About?
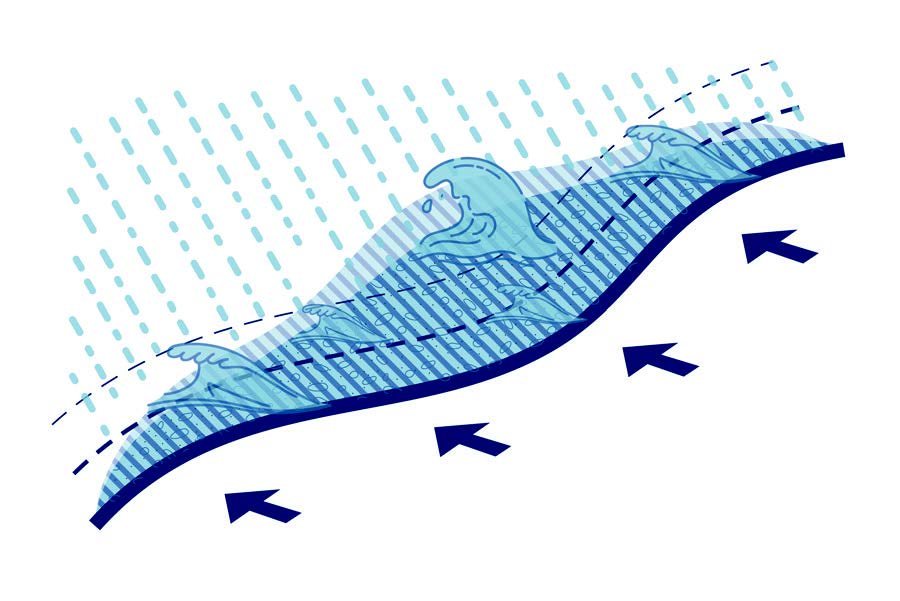
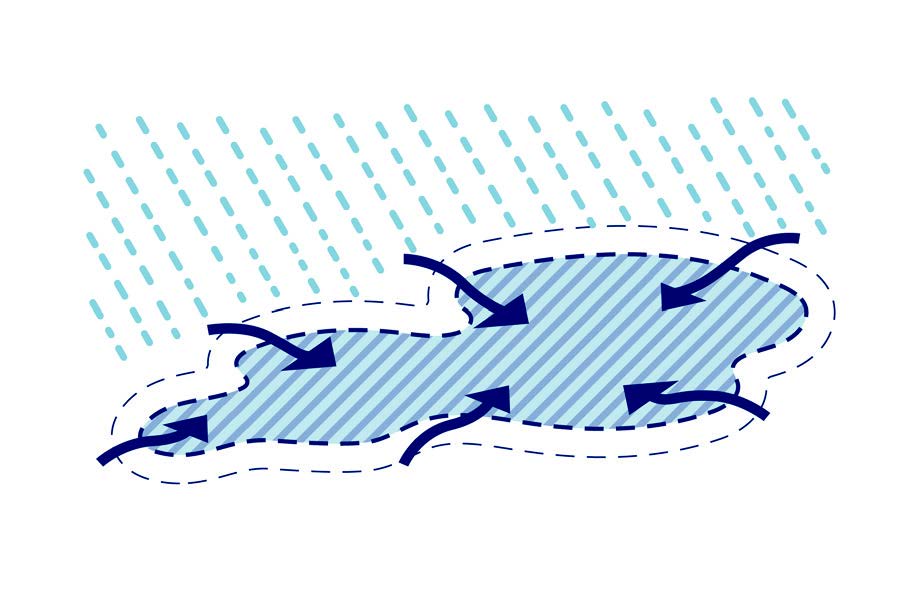
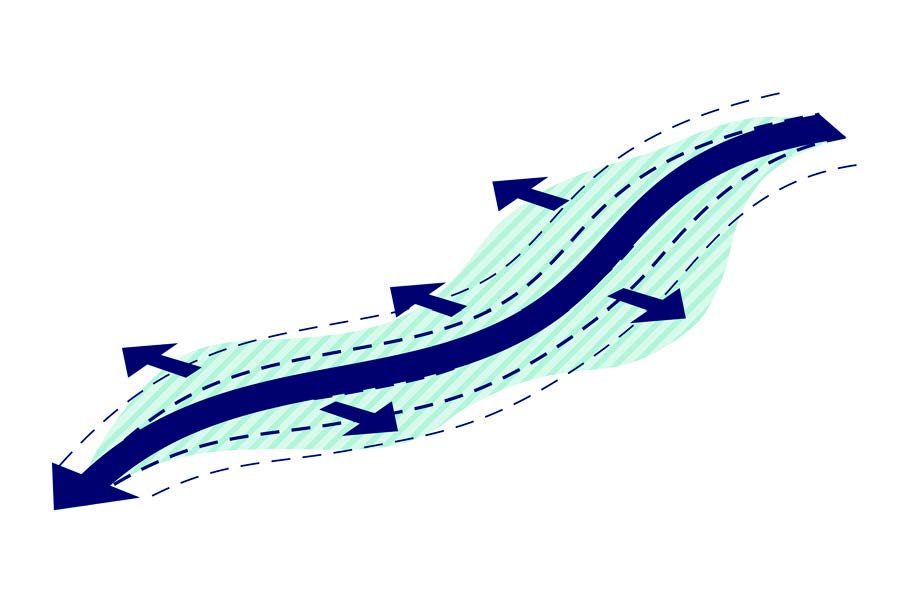
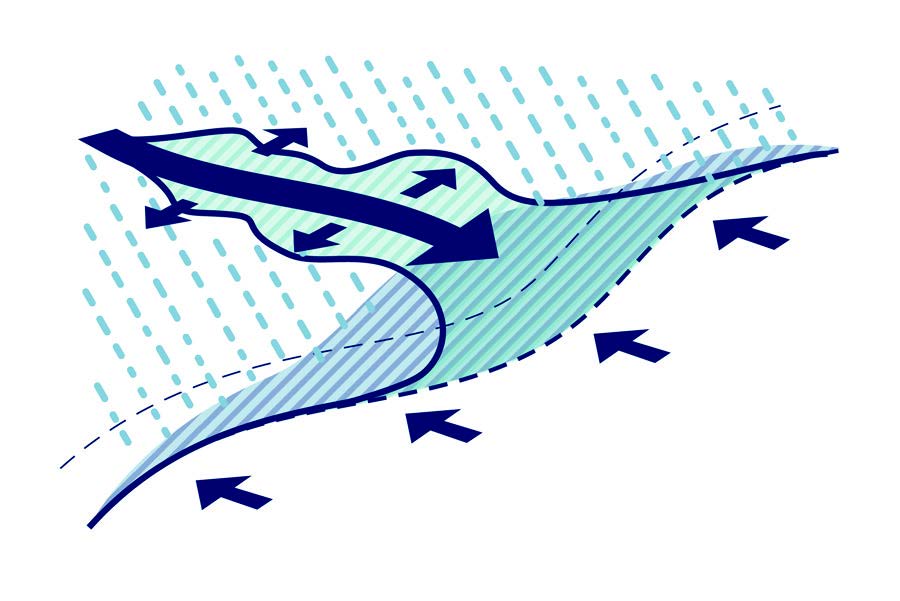
The Northeastern New Jersey region is exposed to a variety of flood hazards. These hazards vary in terms of the source of flooding, affect different areas, and require different strategies to address them.
How Will Climate Change Increase Flood Hazards?
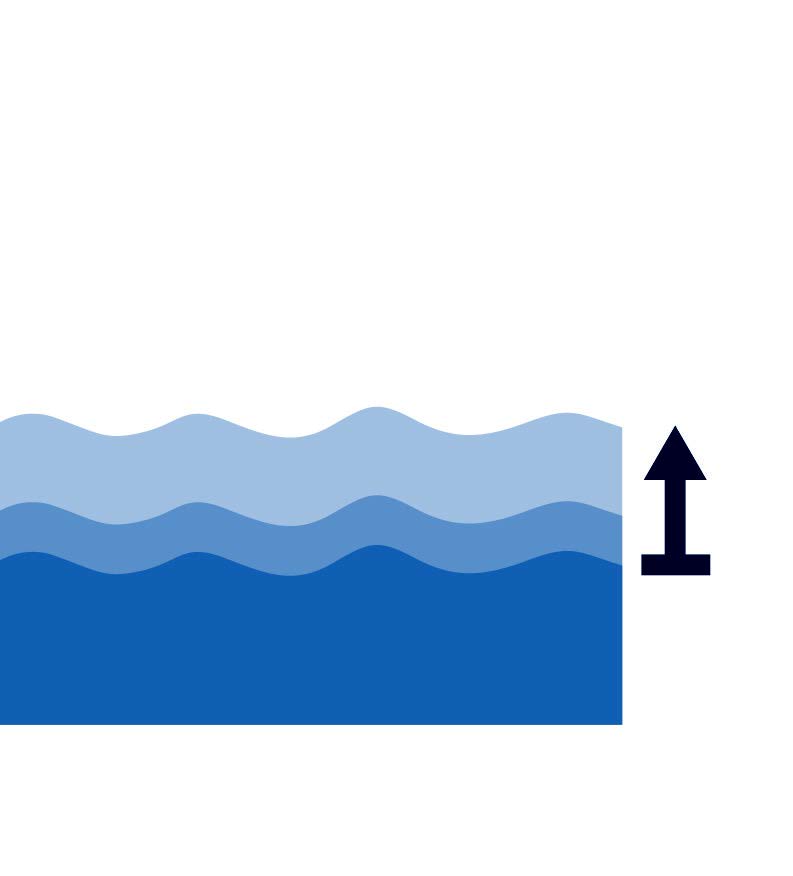
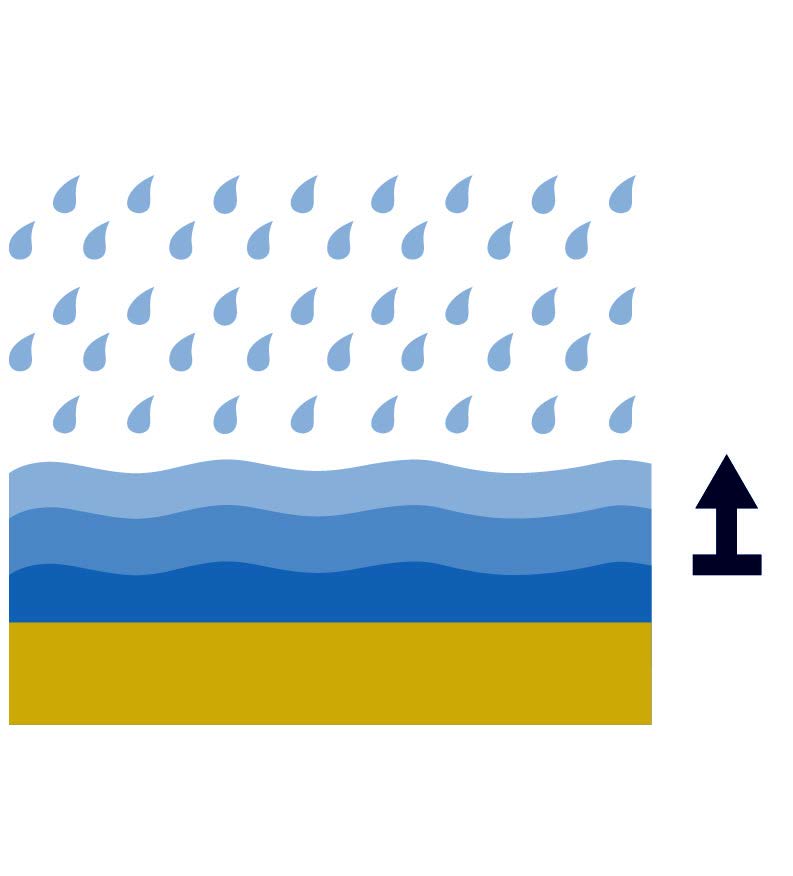
The Northeastern NJ region will be impacted by climate change in a variety of ways. This includes changes in everyday conditions, such as tides and average temperatures, as well as more frequent and severe rain events, severe coastal storm events, and heat waves.
How Can We Affect These Risks?
Everyone can play a role in reducing risk in our communities.
WHAT AREAS OF OUR REGION ARE MOST EXPOSED TO FLOODING?
The map below shows the extents of flooding predicted by new flood models developed by NJDEP for Resilient NJ. The models include the various types of flooding that are most prominent in the NENJ region: coastal storm surge flooding, rainfall flooding, and tidal flooding. Within rainfall flooding, there are models for flash flooding (short and intense) and areal flooding (longer period). The models consider present and future conditions by incorporating increases in rainfall and sea level. The future coastal storm surge projects a future Sandy-like event by adding 2.4 feet of sea level rise to observed high water marks from Hurricane Sandy. The future tidal flood model adds 2.4 feet of sea level rise to the mean higher high water (MHHW) elevations based on nearby tide gauges. The future rainfall flooding (flash flood and areal) models include 2.4 feet of sea level rise from the base year of 2000 and increase the rainfall amount by 10%. Please see the Flood Impact Assessment (links above) for more detail on the models.
These maps are helpful to highlight flood-prone areas and to underscore that a significant portion of the region could be impacted by flooding. Resilient NENJ used information from the flood models along with other data on critical infrastructure and places to estimate possible impacts if no further action is taken. Since Resilient NJ is a regional program, the flood models cover a large area and provide only a coarse estimation of risk. Therefore, these maps should not be used to determine the likelihood of flooding at a single location. The Federal Emergency Management Agency (FEMA) Flood Insurance Rate Maps (FIRM) are an additional data source that may have more locally focused data, but those maps only consider coastal and riverine flooding and do not incorporate rainfall.
Various layers on the map will appear as you zoom in and out. You can toggle between layers using the Show Legend button at the top left of the map.
WHAT ARE THE IMPACTS OF FLOODING?
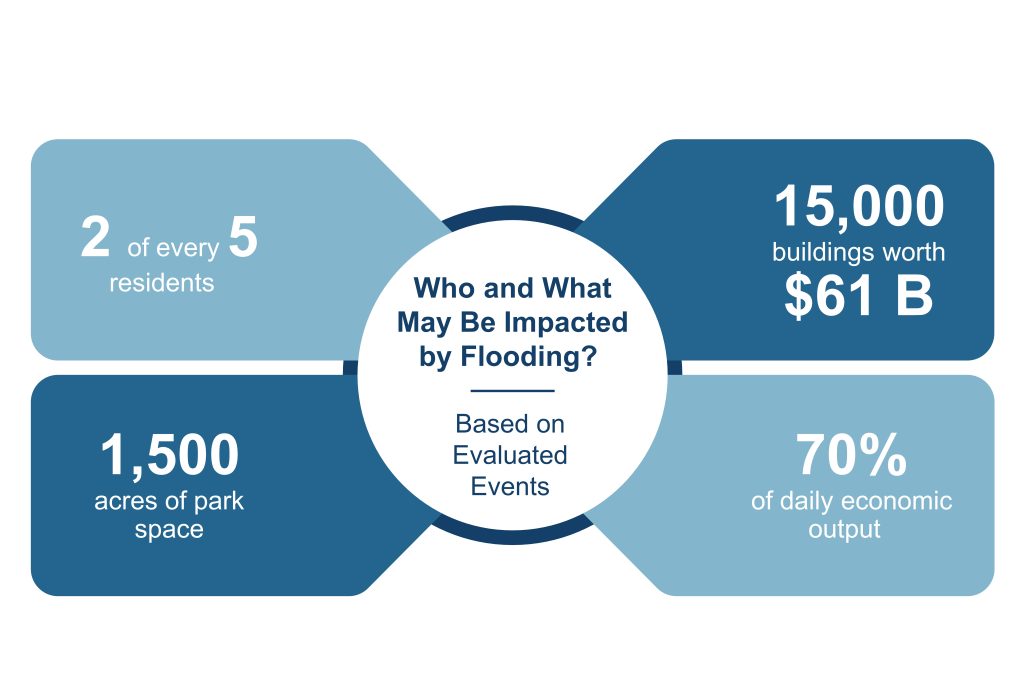
Flooding has the potential to impact many people, businesses, and critical and community facilities in the region. These impacts are felt most acutely by low-income residents, the elderly or disabled, communities of color, and other people who have unique vulnerabilities.
Today, flooding already disrupts commutes, damages valuable belongings, impacts health, and causes anxiety and economic stress for many people in the region, as reflected in stories that Resilient NENJ collected about flooding. These impacts are only expected to worsen with climate change.
My home has flooded frequently in the 41 years I have lived in Hoboken. It has cost me thousands of dollars in repairs and renovations over the years.
Flooding robbed me of treasured things I stored in my basement. Flooding has given me PTSD that is aggravated every time it rains.
Always fearful that my belongings in my basement will be ruined. Fear of mold forming. Yesterday it took me 40 minutes to drive less than a mile because so many streets were flooded.
I have already had 3 feet of water in my basement. I live in fear each time that there’s a storm that it will happen again.
WHAT OTHER CLIMATE-RELATED HAZARDS DOES OUR REGION FACE?
Although Resilient NENJ began as a program focused on flooding, the region faces a variety of other hazards that are also likely to become more severe due to climate change. Some examples are highlighted below, and additional detail is available in the Climate Hazards Assessment.
EXTREME HEAT
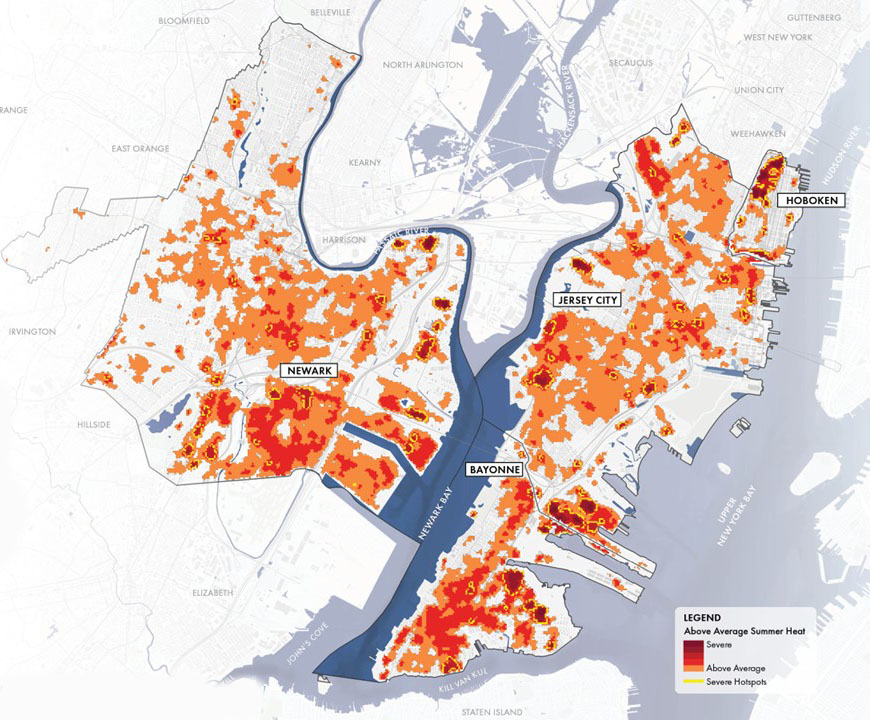
Extreme heat is one of the most dangerous hazards because of its public health impacts, which are most likely to affect people with underlying chronic conditions. The region’s concentration of impervious surfaces and lack of green space contribute to urban heat island effect, or higher temperatures compared to surrounding areas because of the urbanization of the region.
Average summer temperatures in NENJ are projected to increase by as much as 9.6°F (5.3°C) in some areas by 2100. Some areas may see as many as 66 more days per year with temperatures above 90°F (32°C), resulting in more frequent and intense heat waves.
Data source: The Trust for Public Land, Descartes Labs, USGS, accessed through ESRI
AIR QUALITY
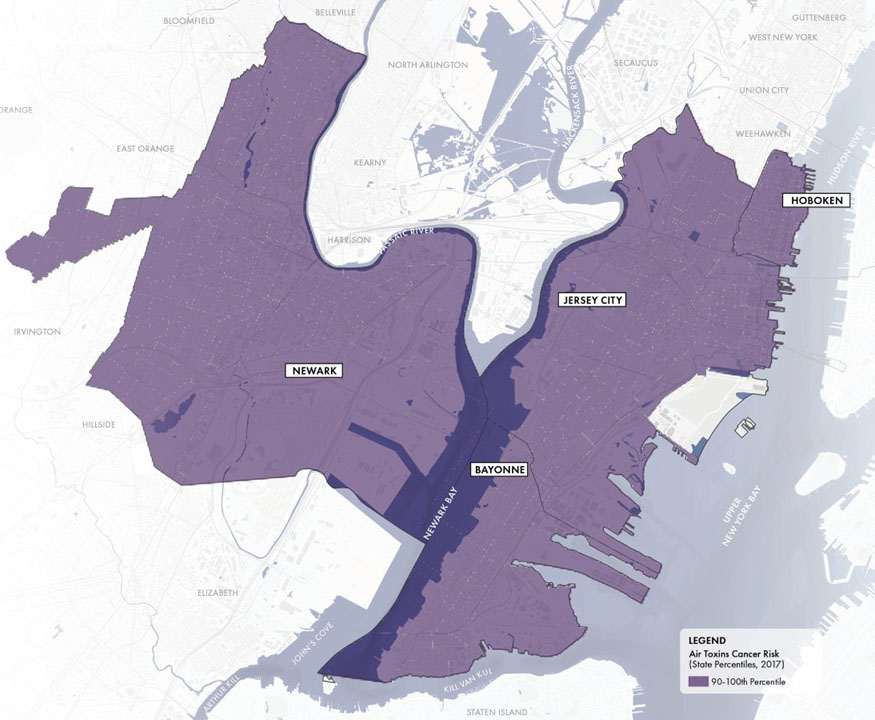
Various types of pollutants can contribute to poor air quality, which can cause “invisible” health effects like asthma, other respiratory issues, and cancer. The density of places and industry in the region leads to high emissions of toxic air pollution. As a result, the region ranks high compared to the rest of New Jersey in various indicators of risk from poor air quality, including from cancer-causing air toxins.
Data Source: EPA EJScreen Mapping Tool
CONTAMINATION AND GROUNDWATER RISE
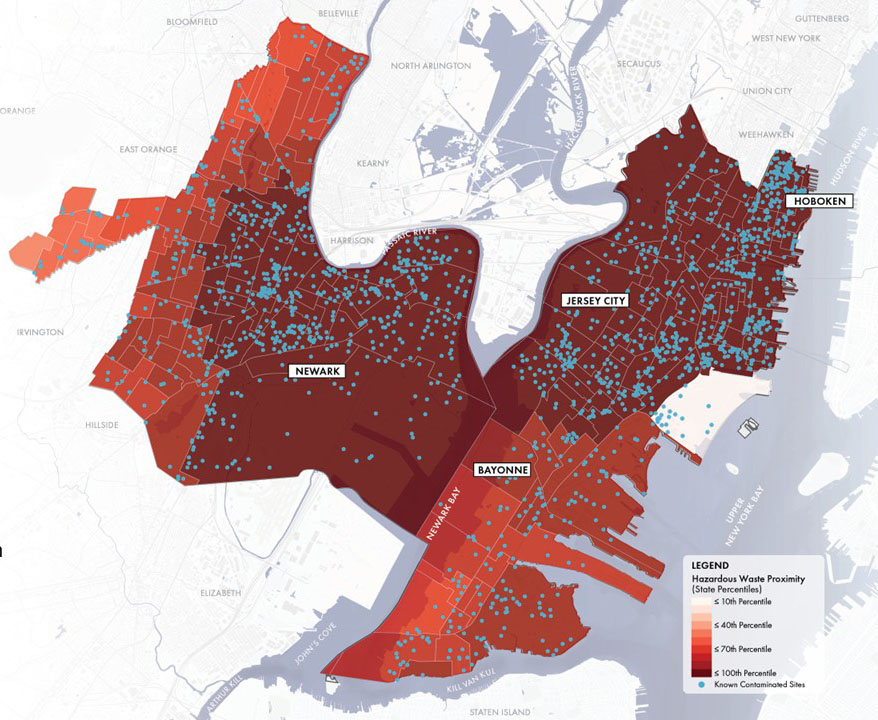
Due largely to the region’s industrial legacy, there are many known contaminated sites in the region that may expose community members to pollution in soil or groundwater.
More research is needed to understand how climate change can exacerbate this problem. For example, groundwater rise could disrupt and spread contaminated groundwater and lead to greater risk of community exposure. Flooding can also spread contamination, as was experienced during Hurricane Sandy.
Data sources: EPA EJScreening Mapping Tool (For underlying hazardous waste proximity, NJDEP Known Contaminated Site List (for points)
Get Involved
Your input and involvement are critical to increasing the resilience of our communities. Opportunities to engage with the program will be updated periodically on the Get Involved page.
STAY IN THE LOOP
Sign up for periodic emails to stay up to date on program process.
EXPLORE OUR RESOURCE LIBRARY
The Resource Library contains our project reports, anytime and youth engagement materials, and other information about progress.


